Measuring what virtual spatial transcriptomics recovers within tissue regions
Virtual spatial transcriptomics predicts gene expression from H&E-stained sections. Its maps are still judged mostly at the tissue level, and a prediction that distinguished only tumour from stroma could pass.
STDetail randomly splits the measured RNA molecules into two halves and asks how well a prediction recovers the local differences that both halves reproduce: within tissue regions, across spatial scales and between neighbouring cells.
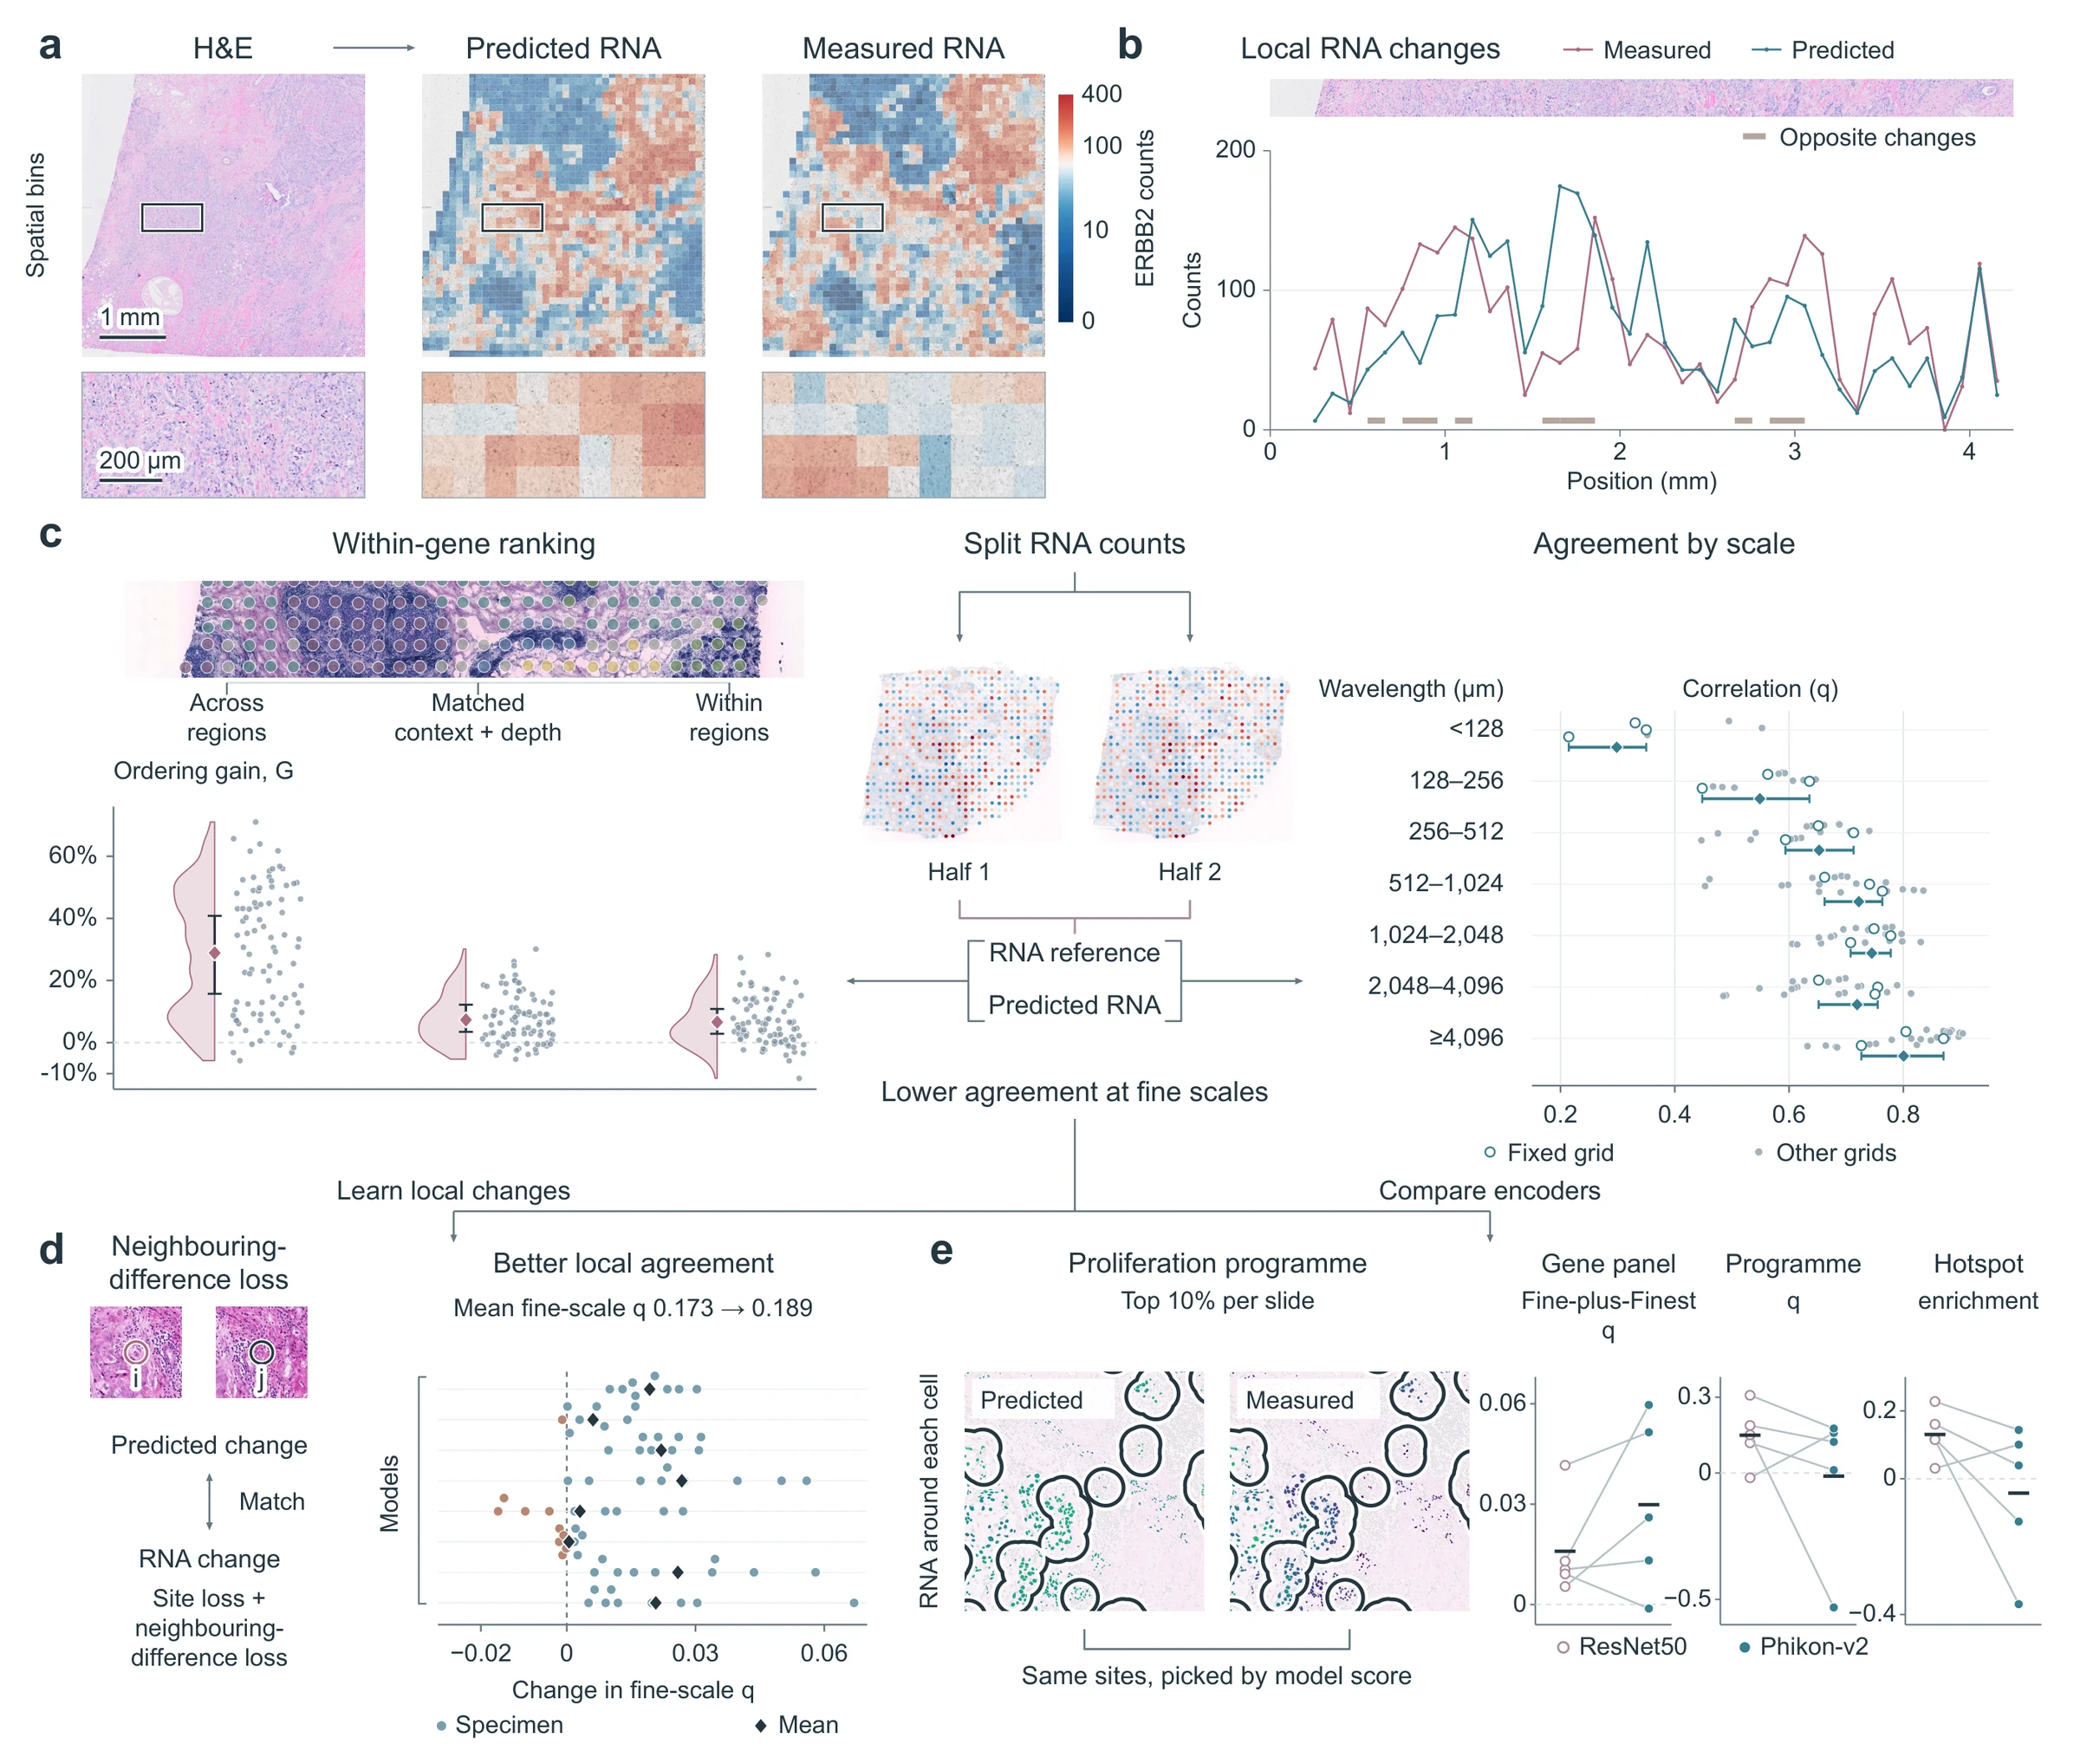
Results
- Fig. 2
Most of the ordering advantage disappears between sites that share tissue context
Model rankings in HER2ST - Fig. 3
Agreement rises with spatial scale, and larger spots shift what is measured
Spatial scales in one HEST section - Fig. 4
Pooling raises single-cell scores without changing predictions, whereas cell-level scores separate methods several-fold
Single-cell data; in the paper - Fig. 5
Predicted TLS scores match pathologists but track measured RNA weakly
TLS readout in HER2ST - Fig. 6
Training on neighbouring expression differences improves local recovery
The loss in one HEST section
With your own predictions
| You have | Open it in | You get |
|---|---|---|
| Measured RNA and predictions as tables | Analyze data | Maps on one colour scale and gene-by-gene correlations, over the whole section or a region you choose; Overall Pearson r for each patient. |
| Molecule counts, predictions and coordinates | Python package | Split RNA counts, then ordering gain G, q across spatial bands and cell-level scores, computed on your machine. |
| Files written by the package | Analyze data, computed results | The figures on this site, as SVG or 300 dpi PNG, each with its source values. |